
Your data tells a story. Let's help it speak.
From raw exploration to structured analysis. We surface the operational patterns, root causes, and decision levers that standard reports miss.
Let's talk about your projectHow structured analysis creates value
Exploration & Diagnostics
We dive into your raw data to map patterns, isolate anomalies, and ask the right questions before jumping to answers.
Causal Analysis
Beyond surface metrics, we uncover root causes — why numbers rise, why they fall, and which levers to activate first.
Actionable Recommendations
Every analysis concludes with a structured report and clear, prioritized recommendations adapted to your operational reality.
Case Study: Operational Analysis (Ambulance)
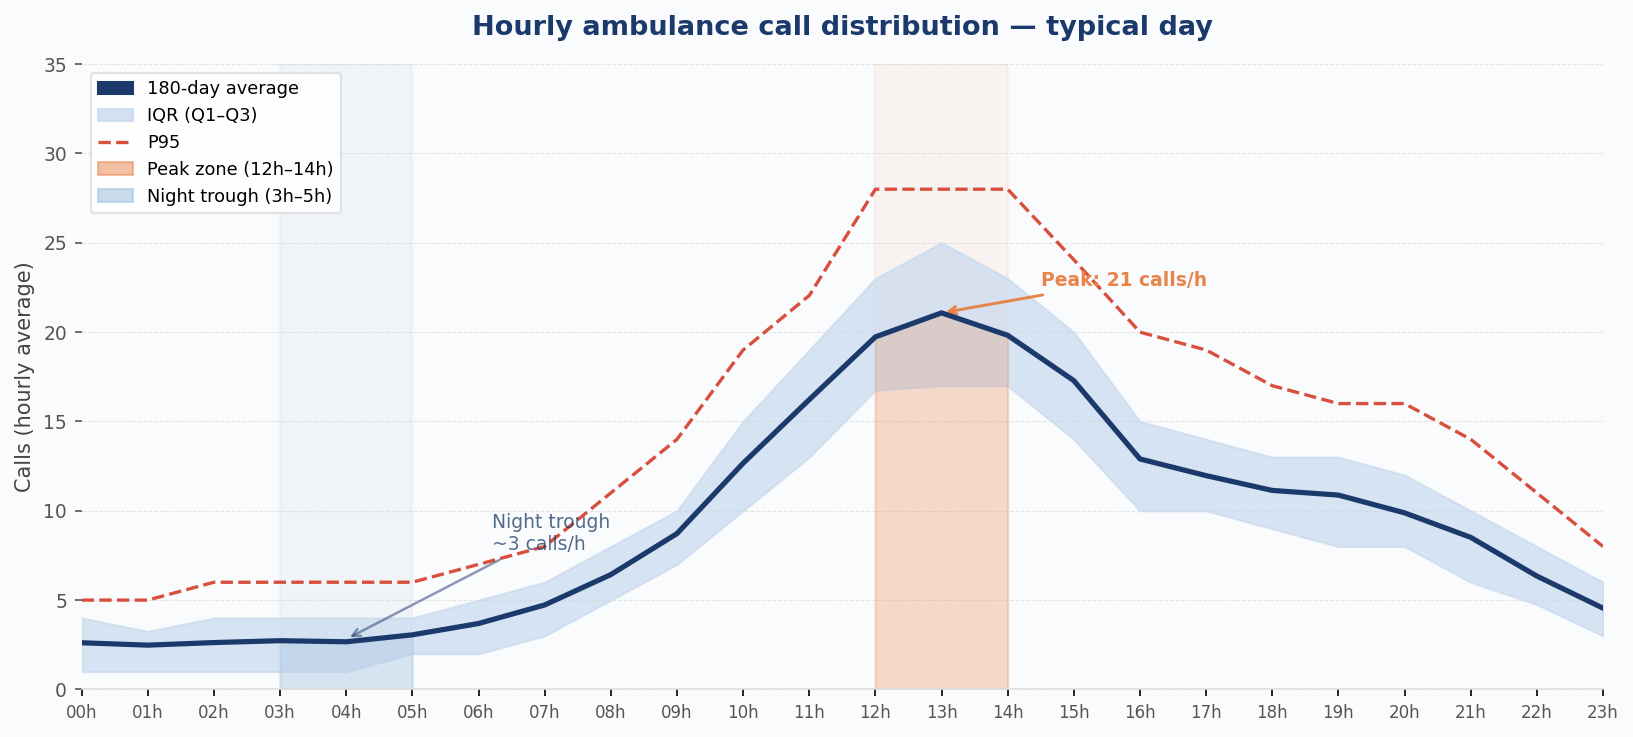
Here is a preview of the type of analysis we perform for clients in the ambulance sector. Using 180 days of call data, we identify key operational patterns: demand peaks, overnight lows, and intervention duration distributions.
~35%
of calls packed into 2 peak hours
+45%
gap between median and mean duration
5%
of cases requiring close monitoring
Demand Distribution
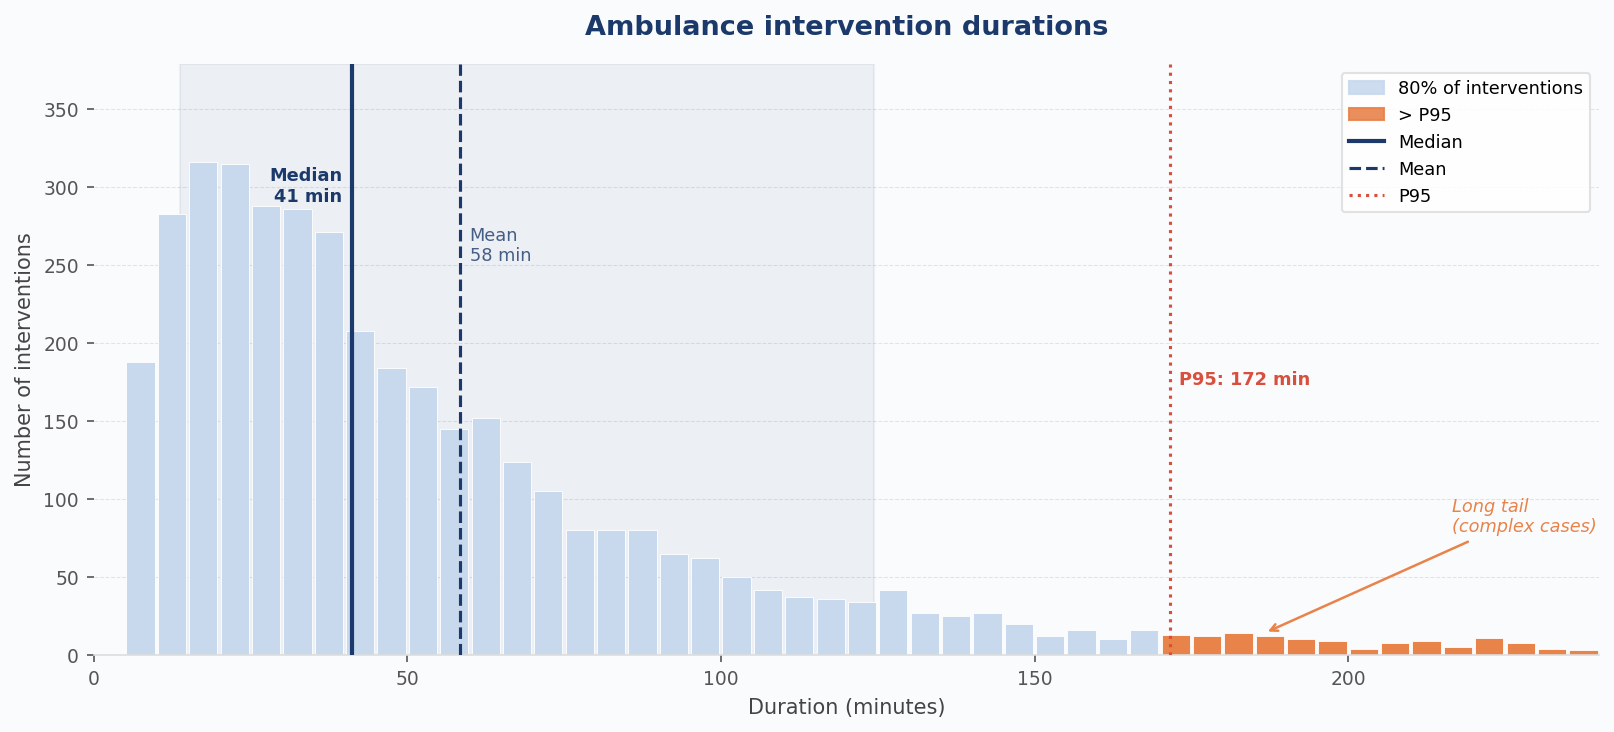
Intervention Durations
What this analysis reveals
- The 12h–14h peak concentrates ~35% of daily calls, creating systematic pressure on shift handover teams.
- The median intervention duration (~40 min) masks a much higher mean (~58 min) — a sign of skewed distribution that demands attention.
- 5% of interventions exceed P95 and often represent the most critical cases — ignoring them distorts any capacity planning exercise.
Your data has answers. We ask the right questions.
A structured analysis can transform how you plan, operate, and decide.
Write to us