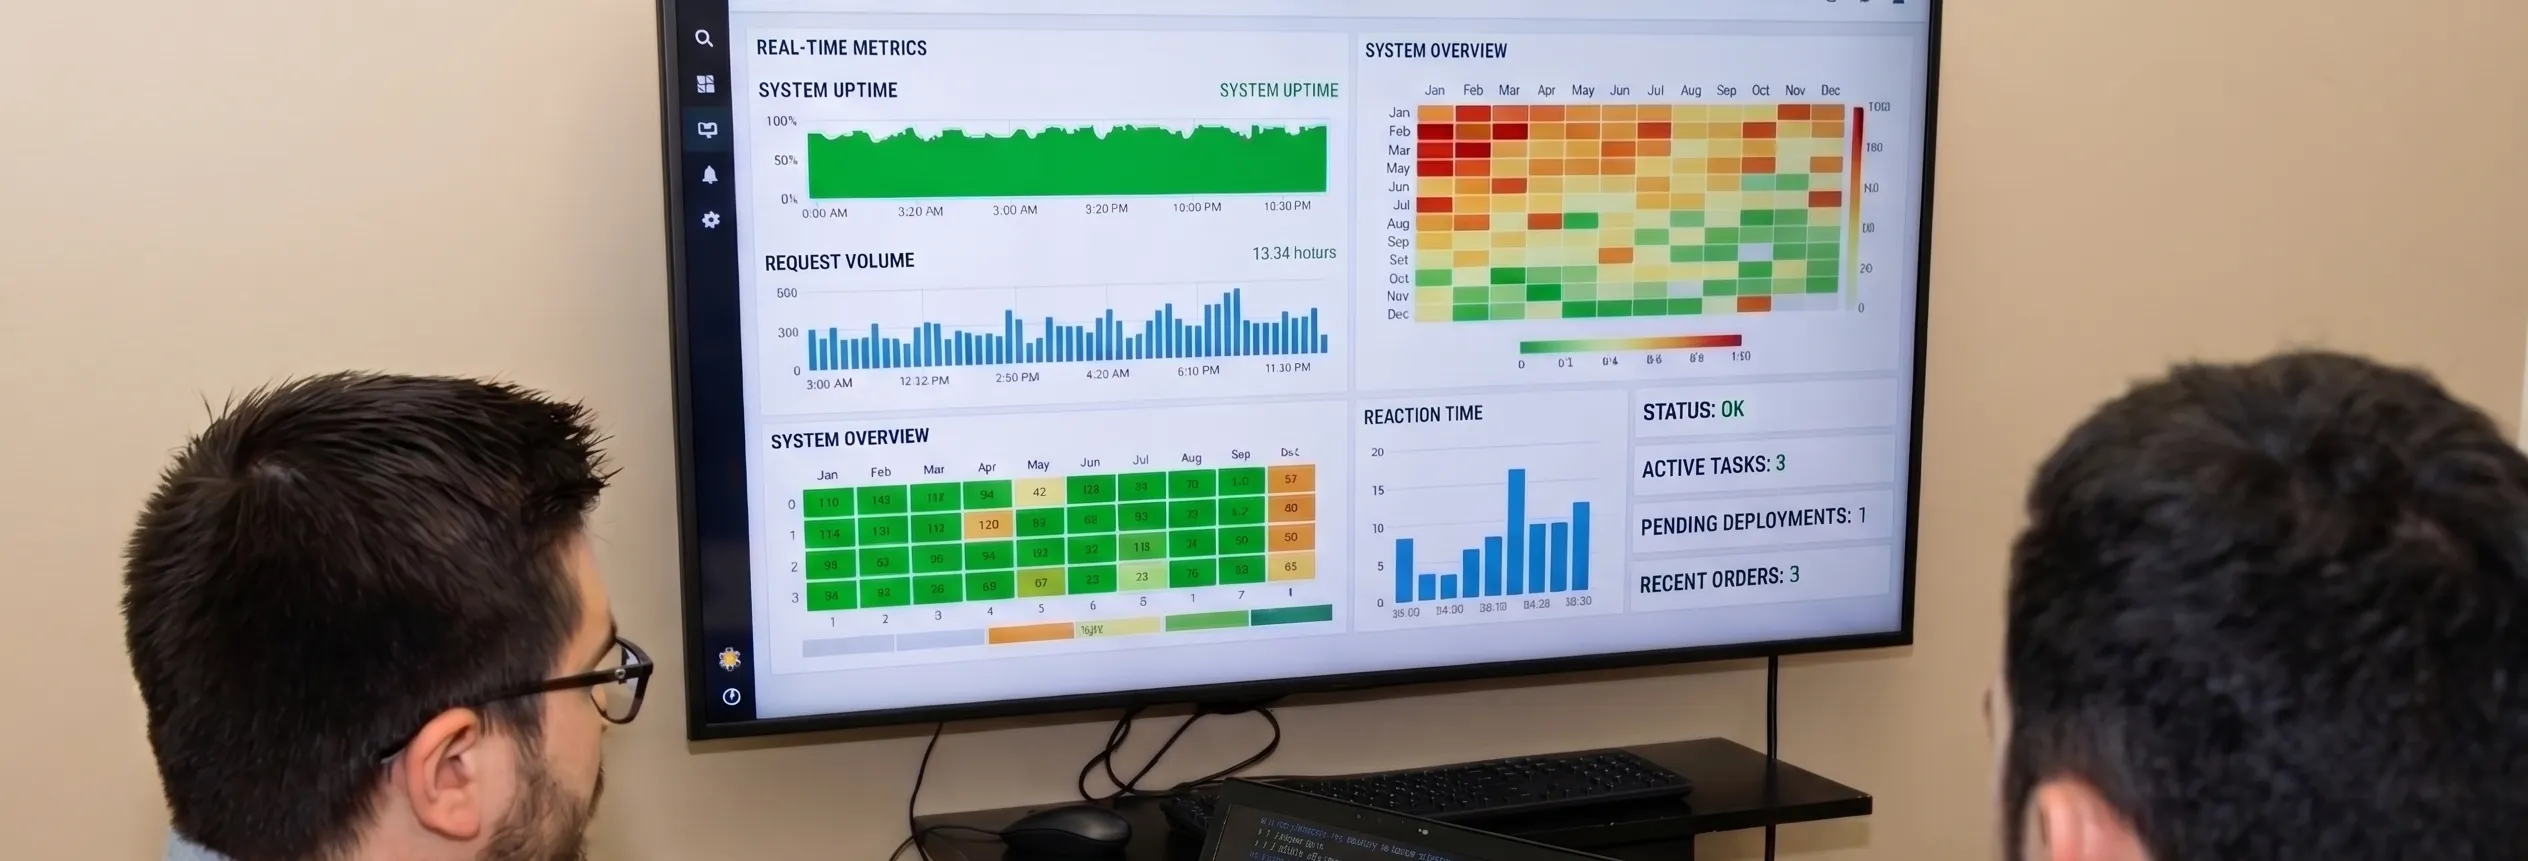
From data to decision — at a glance.
We turn your data into clear, interactive dashboards that give your teams immediate visibility into what actually matters.
Let's talk about your projectHow a great dashboard transforms how you operate
Instant Clarity
An effective dashboard doesn't overwhelm — it reveals. We design visualizations that deliver the essential signal at a glance, no training required.
Data in Context
A number alone says nothing. We structure your metrics with the comparisons, trends, and thresholds that give them meaning — so alerts are impossible to miss.
Faster Decisions
From raw data to action: our dashboards shorten that path. Your teams know what to do, not just what happened.
Case Study: Sales Dashboard (Distribution)
Here is the type of dashboard we design for our clients. Using 24 months of sales data from a distributor, this dashboard tracks revenue trends, benchmarks annual performance, and identifies which categories generate the most value — all at a glance.
+31%
Q3 surge vs annual average
62%
of revenue in just 3 categories
+18%
YoY growth detected in 2024
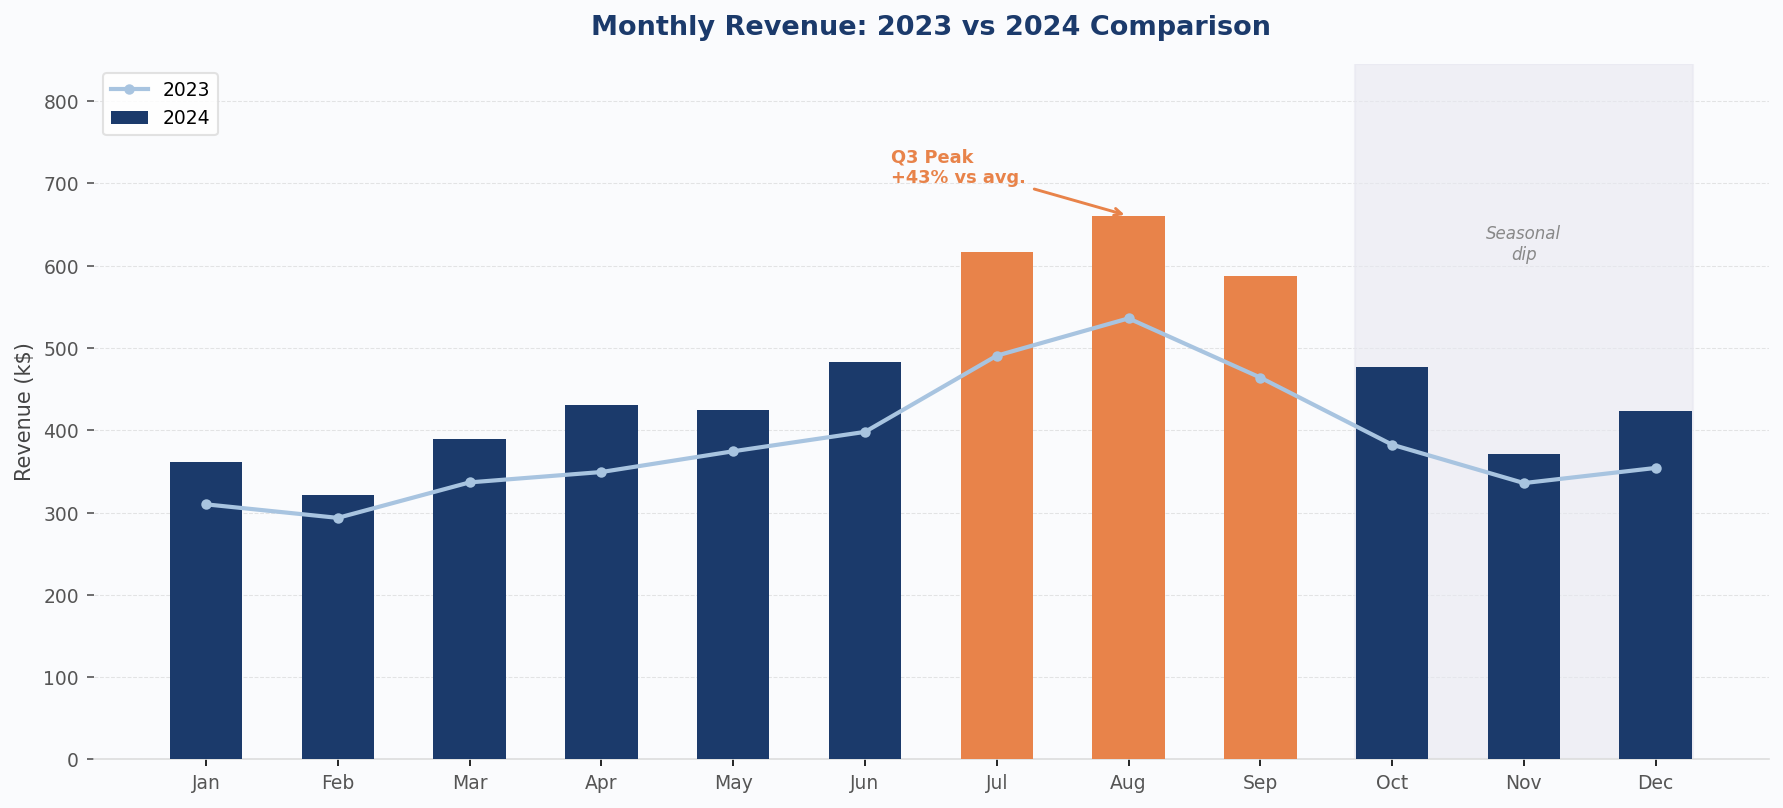
Monthly Revenue
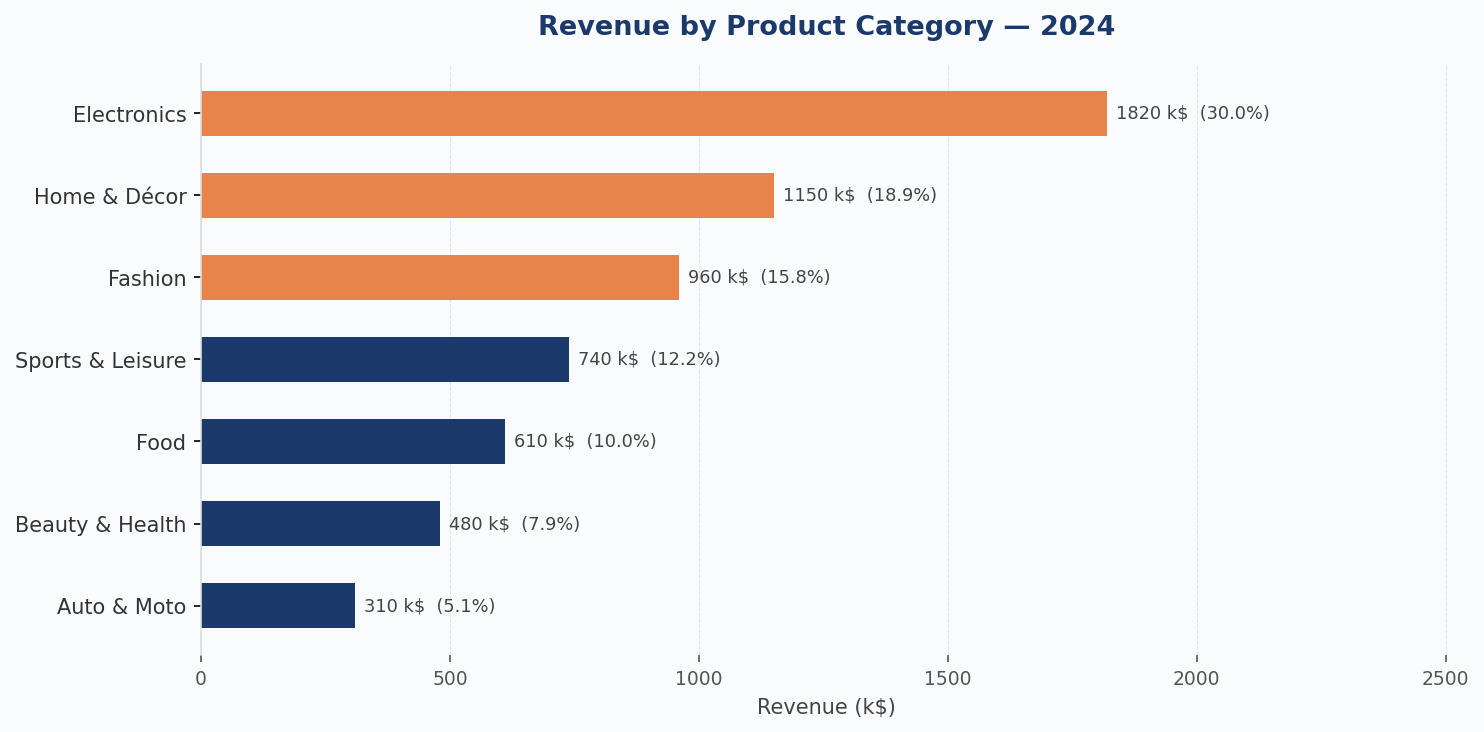
Revenue by Category
What this dashboard reveals
- Q3 (Jul–Sep) is the peak demand period at +31% vs the annual average — a strategic window to optimize inventory and intensify campaigns.
- The top 3 categories generate 62% of revenue: a concentration worth monitoring to anticipate dependency risks and identify new growth drivers.
- The +18% YoY growth in 2024 comes with more pronounced seasonality than in 2023 — a signal to adjust capacity planning accordingly.
Your teams deserve better than spreadsheets.
A well-designed dashboard changes how a team operates — no more digging to find answers.
Write to us