Your scattered data, finally unified.
We design and deploy the technical pipelines that centralize, validate, and make your data accessible — in real time, across all your systems.
Let's talk about your projectHow we unify your data ecosystem
Source Centralization
We connect your scattered systems — ERP, CRM, e-commerce, logistics — via robust ETL pipelines to create a single source of truth.
Quality & Reliability
Every pipeline includes automated quality checks — completeness, consistency, freshness — so your analyses rest on trustworthy data, not approximations.
Real-Time Availability
Your data doesn't stay in silos. We route it to your analytics tools, dashboards, and models in real time or near real time.
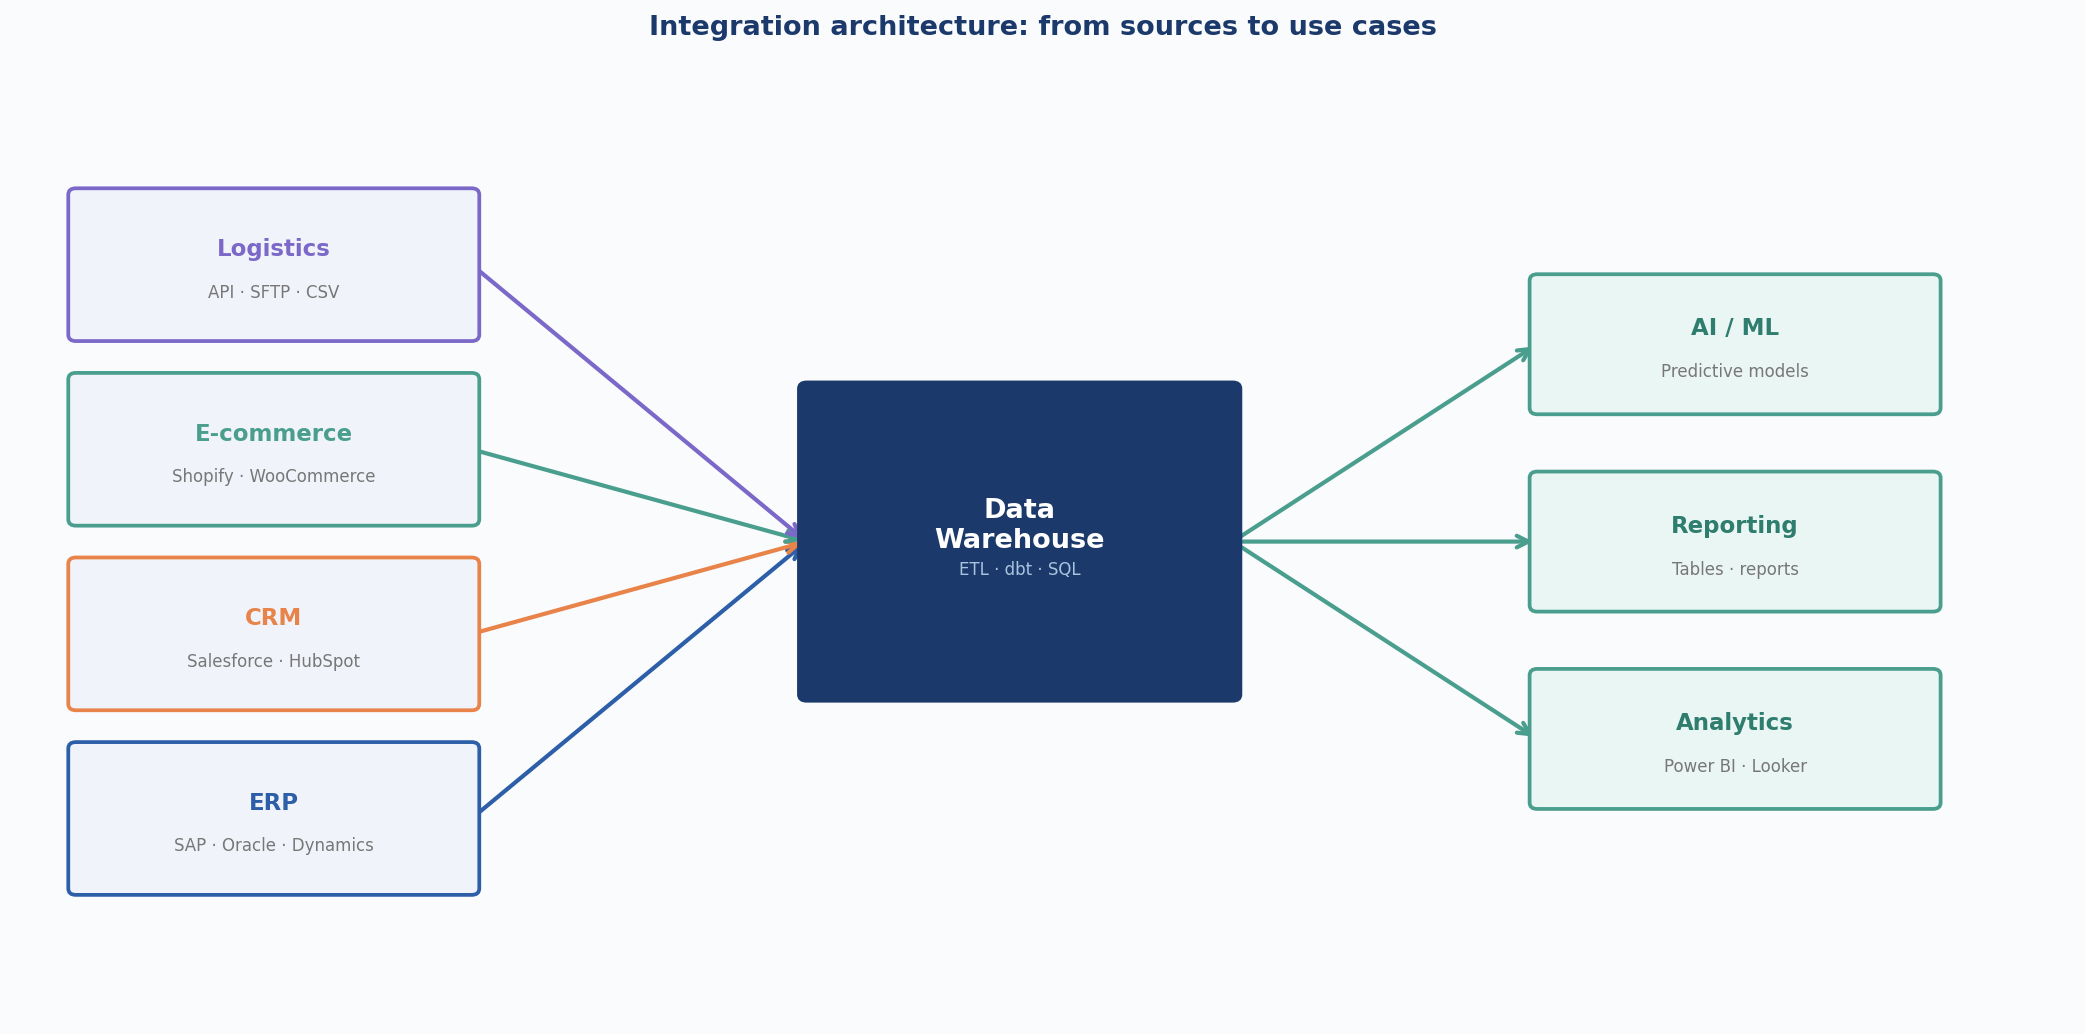
Case Study: Multi-Source ETL Pipeline (Distribution)
Here is the type of architecture we design and deploy for our clients. For a distributor whose data was scattered across ERP, CRM, and e-commerce systems, we designed a complete ETL pipeline — from source extraction to analytics marts — and measured the impact on data quality at every step.
4
siloed sources unified
< 60%
completeness on some sources before integration
> 90%
quality achieved after transformation
Pipeline Architecture
Data Quality
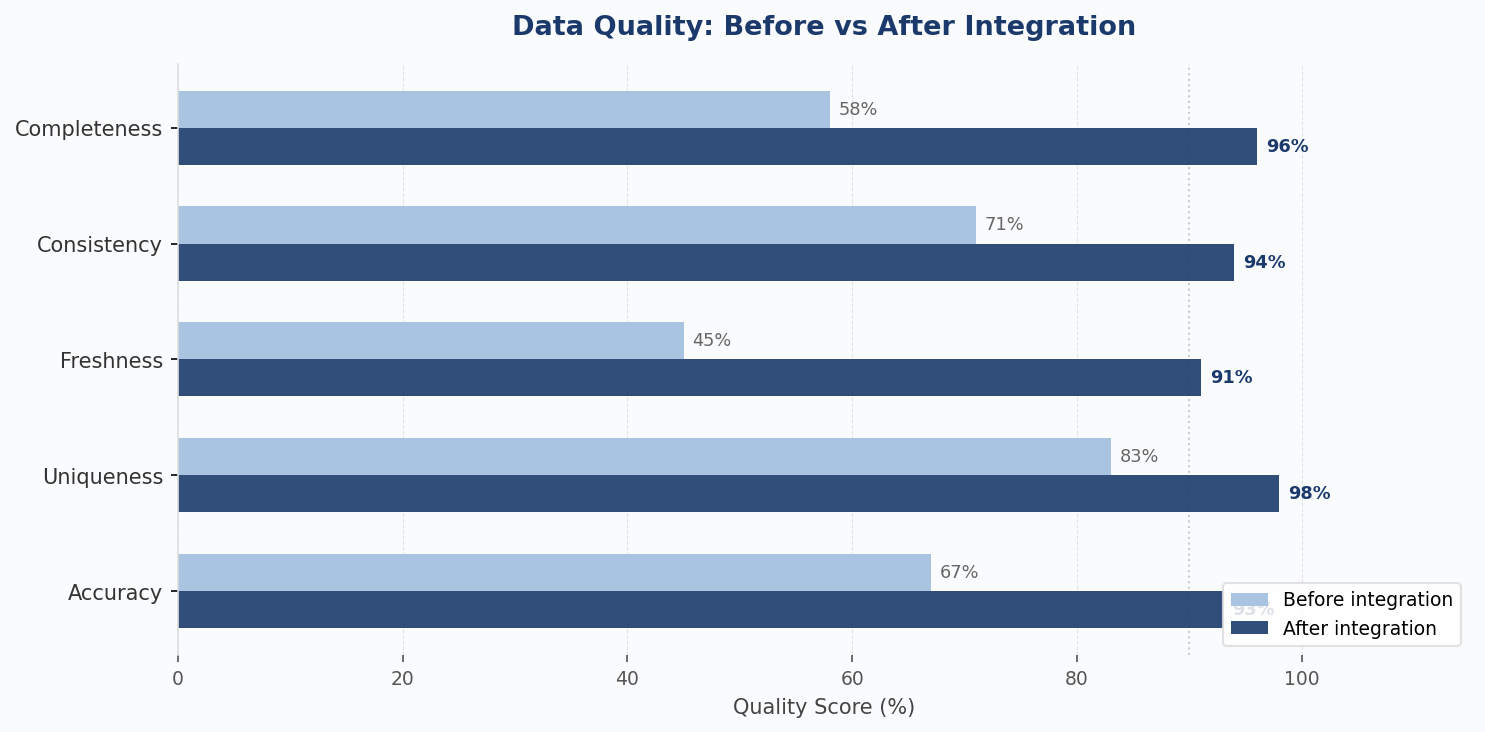
What this monitoring reveals
- CRM volume doubled in month 7 due to a historical migration — an unanticipated spike that would have saturated a pipeline not sized to absorb load shocks.
- Before integration, two sources had completeness below 60%: using that raw data in analytics would have produced skewed results.
- After transformation and reconciliation, all quality indicators exceed 90% — the foundation needed for reliable downstream analyses.
From siloed data to a unified infrastructure.
Every hour your teams spend reconciling sources is an hour they're not spending on analysis.
Write to us